Tag
Column Charts
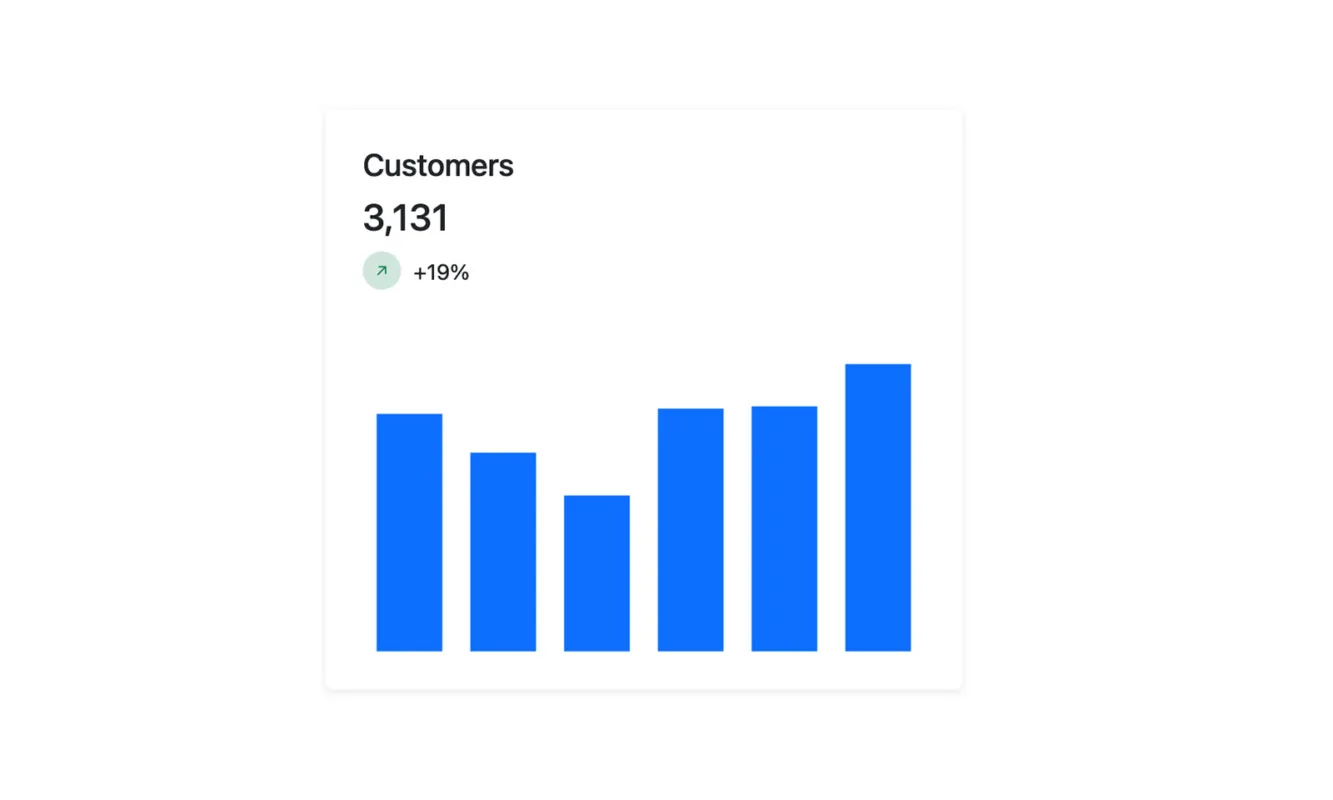
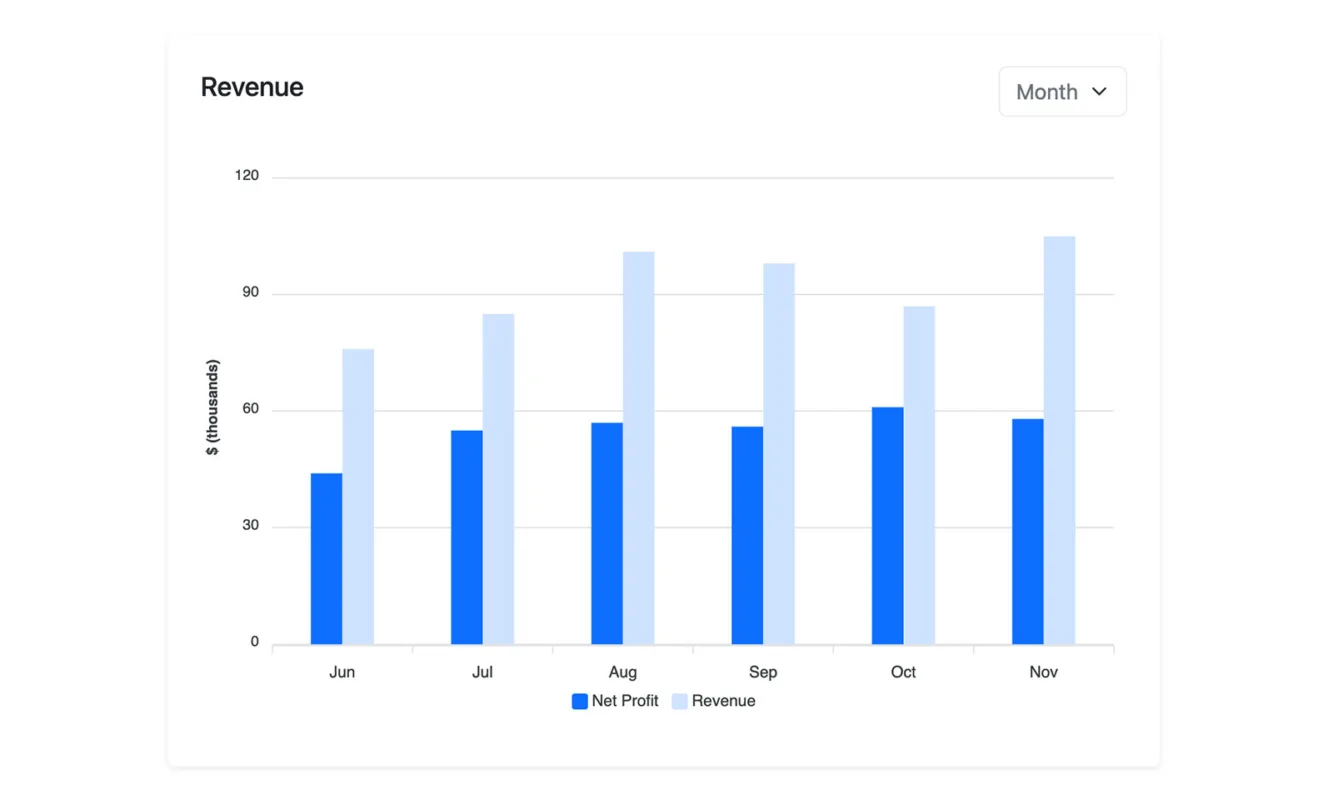
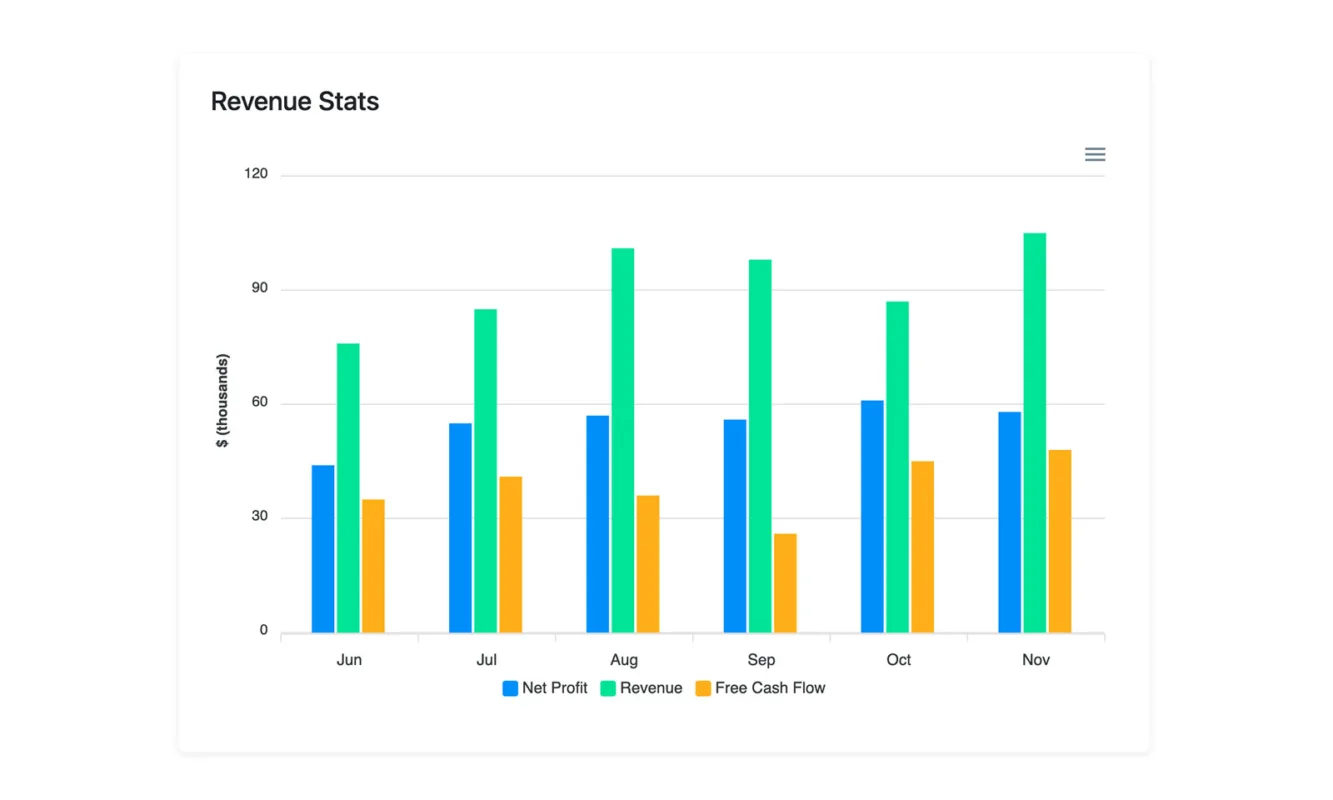
Bootstrap Column Charts effectively display data comparisons across categories or groups by representing values as vertical bars, making it easy to visualize and compare data points. Many third-party libraries used with Bootstrap for column charts offer interactive features like tooltips, drill-down options, animation effects, and user interactivity, enhancing the user experience. Developers can embed these column charts seamlessly within Bootstrap layouts, leveraging the framework’s grid system and responsive design for consistent integration and display.