Tag
Line Charts
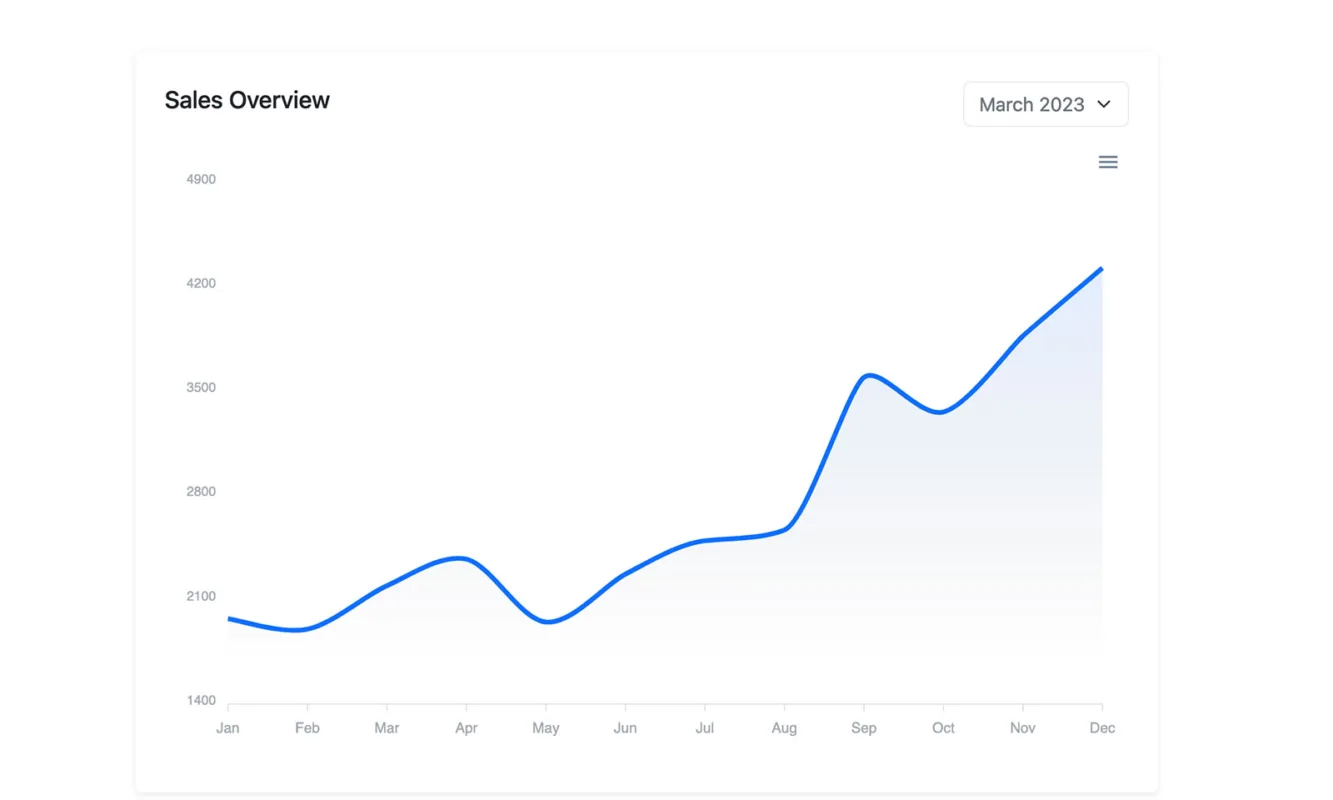
Bootstrap Line charts clearly depict data trends over time, aiding in understanding patterns, fluctuations, and correlations within datasets. Line charts are graphical representations that showcase data trends through a series of data points connected by lines. They illustrate changes over time, making them ideal for visualizing trends, comparisons, or correlations in datasets with continuous data.