Best WordPress Data Visualization Plugins for 2024
WordPress has evolved from a simple blogging platform to a powerful content management system capable of handling diverse data types. As the importance of data visualization grows in digital communication, WordPress users seek effective ways to present data visually engagingly. This quest has led to the development of numerous data visualization plugins, offering users a range of options to create compelling visual representations of their data. This post will explore WordPress data visualization plugins’ significance, functionality, and popular options.
Pro WordPress Themes
Free WordPress Themes
Bootstrap 5 Templates
Bootstrap One Page Templates, Bootstrap 5 Templates, Free Bootstrap Templates
The Significance of Data Visualization
Data visualization is crucial in making complex information more understandable and accessible to a broader audience. By presenting data in graphical formats such as charts, graphs, and maps, users can quickly grasp patterns, trends, and insights that might be difficult to discern from raw data alone. In WordPress, integrating data visualization enhances the user experience, improves engagement, and strengthens the effectiveness of content delivery.
The functionality of WordPress Data Visualization Plugins
WordPress data visualization plugins offer a variety of features and functionalities to cater to different user needs. While specific capabilities may vary depending on the plugin, standard functionalities include:
- Chart Creation: Plugins allow users to create pie charts, bar charts, line charts, and scatter plots. Users can customize colors, labels, and other chart elements to suit their preferences.
- Graphical Representation of Data: Plugins transform raw data into visually appealing graphics, instilling confidence in users by enabling them to communicate information effectively through well-crafted charts and graphs.
- Interactive Elements: Many plugins offer interactive features such as tooltips, zooming, and filtering, allowing users to explore data dynamically and gain deeper insights.
- Integration with Data Sources: Some plugins enable integration with external data sources, including spreadsheets, databases, and APIs, streamlining the process of importing and updating data for visualization.
- Responsive Design: With the increasing prevalence of mobile devices, responsive design is essential. WordPress data visualization plugins often provide responsive layouts that adapt seamlessly to different screen sizes and devices.
Several data visualization plugins are widely used within the WordPress community, each offering unique features and functionalities. Some of the popular options include:
Graphina

Generating WordPress charts and graphs can be a cumbersome and dull task. But fear not, as we’ve revolutionized the process to make it significantly simpler, faster, more robust, and even enjoyable. Introducing the most ruthlessly effective Charts & Graphs plugin, tailored for swiftly implementing data visualization in WordPress unlike any other.
However, without upgrading to Graphina Pro, manual data input will be necessary, and dynamic chart creation won’t be possible. It’s important to mention that while Graphina is compatible with the block editor, accessing the Gutenberg version requires a payment.
Features:
- Dynamic charts with data from GOOGLE SHEETS
- Auto-AJAX re-loading for optimal website performance
- Chart permissions to restrict access to data
- Create charts from FIREBASE
- Conditional Colors for Counters
AI Infographic Maker
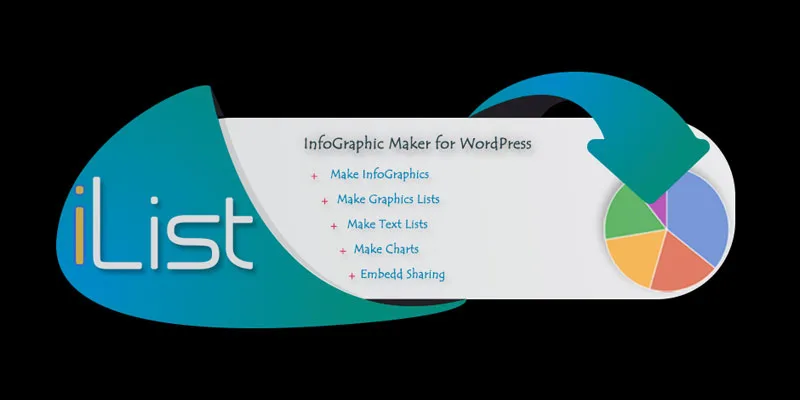
Introducing iList, the AI Infographics Maker featuring Charts and Graphs. With iList, crafting elegant infographics and lists is a breeze, utilizing OpenAI to generate compelling content.
Create eye-catching listicles in no time with this innovative WordPress plugin. iList is the first of its kind, allowing you to generate free AI infographics directly from your WordPress backend.
Features:
- Create Infographics Automatically with OpenAI, ChatGPT
- Unlimited iLists – Info Lists, Graphics Lists, InfoGraphics & MultiPage Listicles!
- Make Multi page Listicles with unique URLs and Ad Space to generate money
- Create Dynamic Text Lists Easily
- Integration with OpenAI
Data Tables Generator
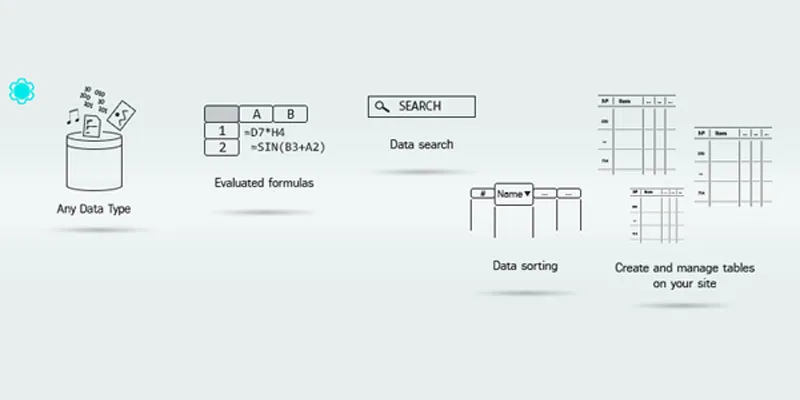
Next, we’ll explore Data Tables Generator. This WordPress tool is specifically designed for data visualization, focusing primarily on tables. However, with an upgrade to a pro plan, you can also utilize it for generating graphs, charts, and diagrams.
Nonetheless, Data Tables Generator truly excels in crafting advanced data tables. For instance, you can create tables equipped with filtering, search, sorting, and pagination functionalities. Additionally, it offers the capability to generate WooCommerce product tables, making it a valuable choice for e-commerce businesses.
Features:
- Import/export data from CSV, Excel, PDF, and Google Sheets
- Create tables, charts, diagrams, and graphs
- Support for images, links, and videos
- Responsive mode feature
Dashboard Builder

Dashboard Builder is an exceptional WordPress plugin that empowers users to showcase data extracted from the WordPress database through advanced data visualization techniques.
It leverages the D3.js library to create responsive and dynamic charts presented in a graphical layout, ensuring the most pertinent information is easily comprehensible at a glance.
Features:
- Supports variety of charts type such as Area, Bar, Line and scatter charts
- Ability to connect any MySQL database even outside of WordPress
- No Programming Skills Required: It is easy to install and configure
- Fully D3.js Responsive & Dynamic Chart
IChart
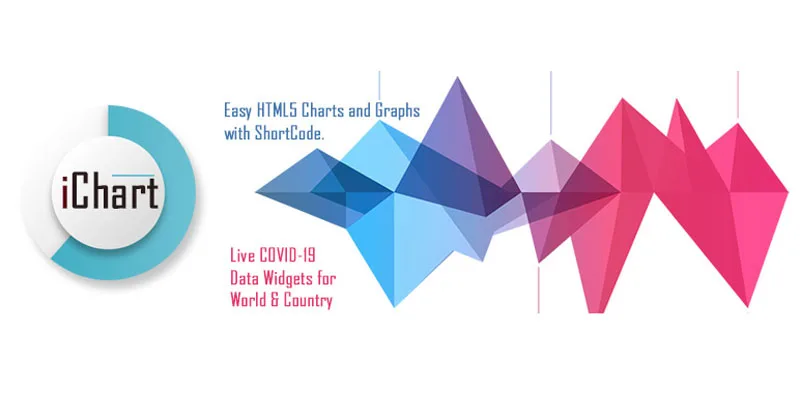
Crafting responsive charts and graphs for your WordPress site has never been simpler. With just a few clicks and the assistance of a shortcode generator, you can effortlessly integrate them into any page.
iChat is a Chart.js implementation designed to seamlessly incorporate stunning, responsive graphs and charts into your website directly from the WordPress page or post editor.
Features:
- Quick ShortCode Generator for Charts
- No Chart saving or data table option
- HTML5, Responsive Charts
- Supports Pie Charts, Bar charts, Line Charts, Doughnut Charts and Polar Area Charts
WP Charts and Graphs
The WP Charts and Graphs plugin equips your WordPress admin with a robust chart generator. It enables you to preview the chart instantly within the admin interface before publication.
The process is straightforward: you define the titles and values, select the chart type, and the plugin automatically generates a shortcode for you to embed on any page or post.
Features:
- Responsive, Mobile-Friendly
- Live Preview on admin
- Several chart types
- Chart generator
UberChart
UberChart harnesses the extensive customization capabilities offered by the Chart.js library within the WordPress environment. With a staggering 240 customization options per chart and 30 options per dataset.
This plugin caters to data visualization experts seeking complete control over every aspect of their charts. Begin crafting flawless HTML-based charts now with UberChart!
Features:
- The possibility to export the chart data to external spreadsheets
- Faster data editing. (compared to standard chart plugins that use input field)
- The ability to paste data available from other spreadsheet editors like Excel, OpenOffice Calc, Google Sheets, and more.
WordPress data visualization plugins empower users to transform raw data into engaging visual representations, enhancing the presentation and understanding of information on their websites. By leveraging the functionalities offered by these plugins, WordPress users can effectively communicate insights, trends, and analyses to their audience visually compellingly. Whether you’re a blogger, marketer, or data analyst, integrating data visualization into your WordPress site can significantly elevate its impact and effectiveness in conveying information. Explore the diverse range of WordPress data visualization plugins available and unleash the power of visual storytelling on your website.
Bootstrap 5 Components
Bootstrap Login Forms, Bootstrap 5 Snippets, Bootstrap Cards, Bootstrap Carousels, Bootstrap Heroes, Bootstrap Footers
Related Posts
Browse our collection of related blog posts, where we delve deep into the fascinating design and development world. Whether you’re a seasoned enthusiast looking to expand your knowledge or a curious newcomer eager to learn more, this compilation of articles will serve as your guiding light.