Tag
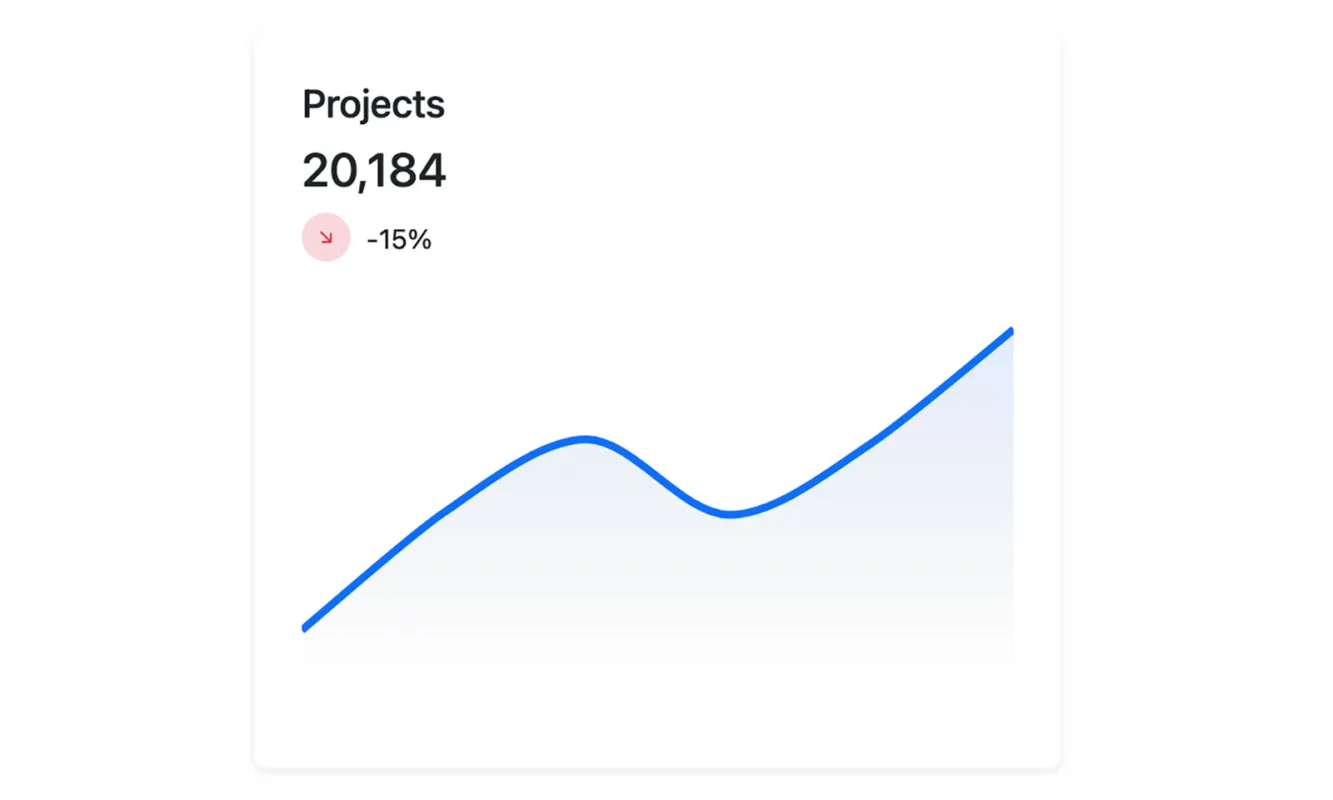
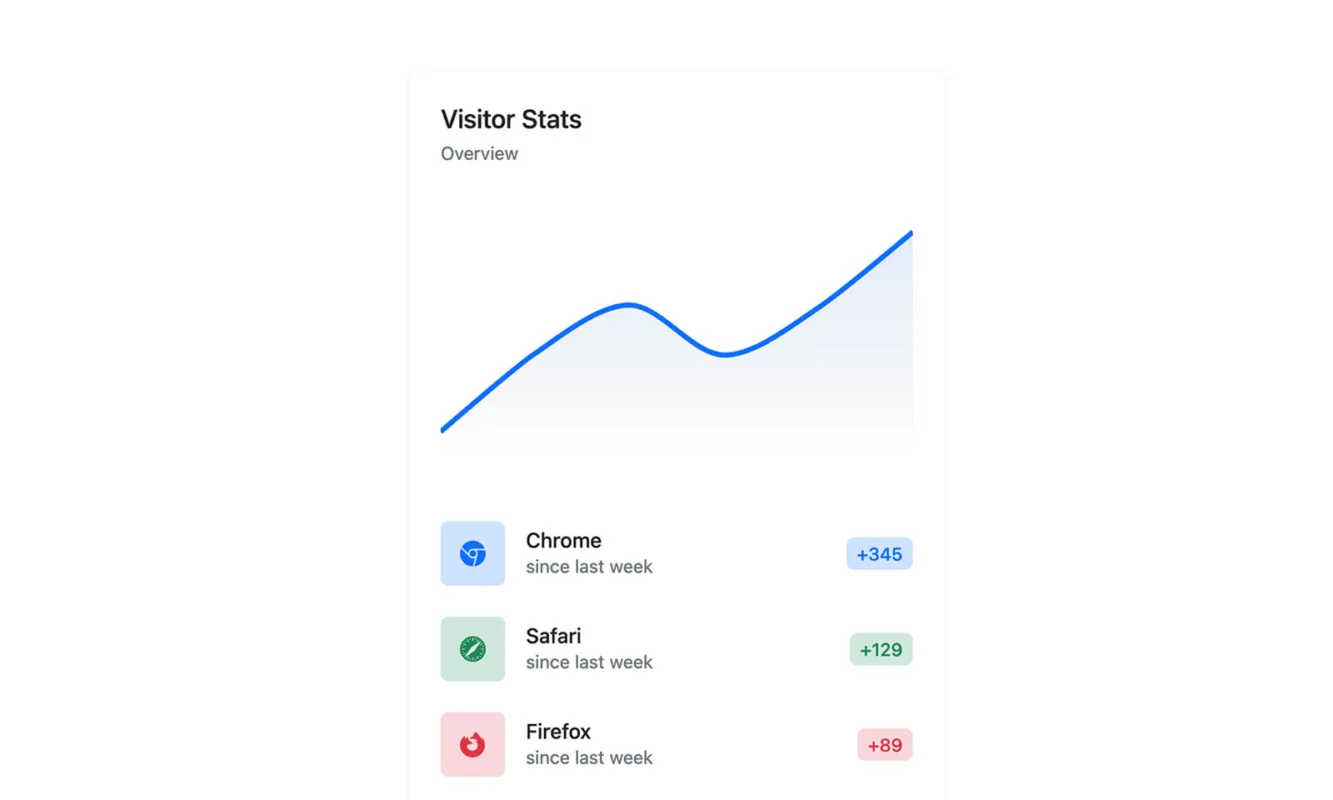
Area Charts
Integrated with the Bootstrap framework, Area Charts allow developers to create visually engaging and informative representations of quantitative information. Area Charts provide a clear visual representation of data trends by displaying the relationship between values over time or categories, illustrating the magnitude of change. Interactive Bootstrap Area Charts allow users to hover over data points to view specific deals or enable tooltips for additional information.