Tag
Doughnut Charts
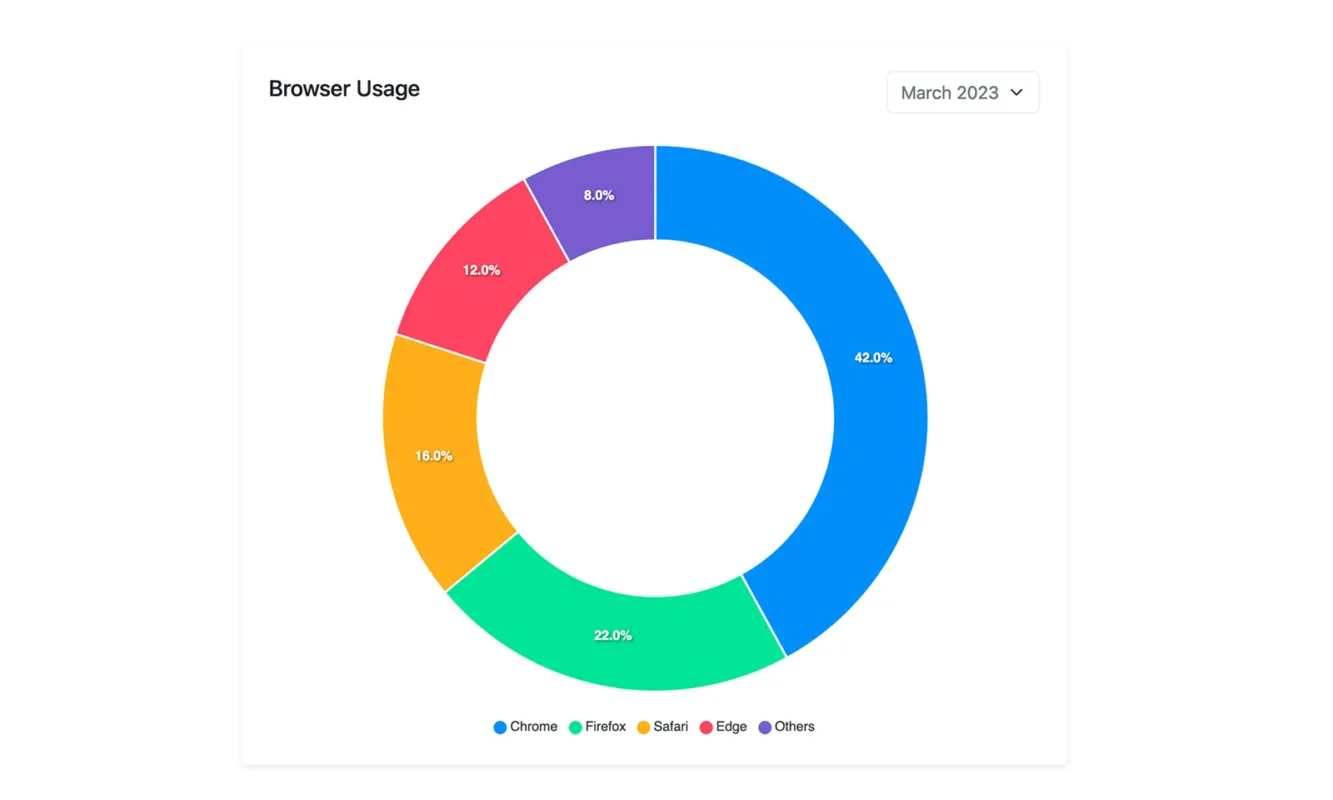
Data visualization is a cornerstone of modern web development, and doughnut charts stand out as powerful tools within the Bootstrap framework for presenting data visually compellingly. These circular statistical graphics offer a concise yet informative way to showcase proportional relationships and breakdowns within a dataset. Doughnut charts effectively illustrate data distribution, displaying individual categories or data points and their respective proportions as segments within the circle.